Demonstrating Process Risks are ALARP: How Low is Low Enough?
A comprehensive look at how high-hazard industries demonstrate that risks are As Low As Reasonably Practicable (ALARP). The article covers regulatory expectations in the UK, EU and internationally, explains risk tolerability criteria (broadly acceptable, tolerable if ALARP, unacceptable regions), details quantitative and qualitative risk assessment tools (QRA, LOPA, FTA, ETA, risk matrices) used to show ALARP, and illustrates the principles with real-world case studies from the oil and gas and hydrogen sectors. The content is universally applicable across technologies, with sector-specific examples enhancing the discussion.
Demonstrating ALARP in the Process Industries
Ensuring safety in high-hazard industries means showing that all significant risks have been reduced As Low As Reasonably Practicable (ALARP). The ALARP principle requires that risk is lowered to the lowest level reasonably achievable without grossly disproportionate sacrifice. In practice, this means companies must continuously evaluate hazards and implement all safety measures that are not unreasonably costly or impractical relative to the risk reduction achieved. Demonstrating ALARP is a cornerstone of safety management in industries such as oil and gas, chemicals, nuclear power, and emerging fields like hydrogen energy. This article expands on how ALARP demonstrations are carried out, covering the regulatory and legal expectations, the risk tolerability criteria that define what is “acceptable,” the analytical tools used (QRA, LOPA, FTA, ETA, risk matrices), and real-world examples illustrating ALARP in action. Throughout, the focus remains on universally applicable principles, with sector-specific examples providing concrete illustration.
Regulatory Expectations and Legal Frameworks for ALARP
United Kingdom (UK): The ALARP concept is deeply embedded in UK safety law and regulations. The Health and Safety at Work etc. Act 1974 (HSWA) requires employers to ensure safety “so far as is reasonably practicable” (SFAIRP). This phrase is effectively equivalent to the ALARP requirement, as confirmed by UK case law (the Edwards v. National Coal Board case in 1949 defined “reasonably practicable” by balancing risk reduction benefit against the cost, with a bias that risk should be reduced unless the cost is grossly disproportionate to the benefit). In high-hazard sectors, regulators expect duty-holders to explicitly demonstrate ALARP in their safety documentation. For instance, the UK Health and Safety Executive (HSE) requires that major hazard installations subject to the Control of Major Accident Hazards (COMAH) regulations show that “all measures necessary” have been taken to prevent major accidents – wording which HSE interprets as equivalent to reducing risk ALARP. Top-tier COMAH sites must submit Safety Reports that include a clear demonstration that risks of major accidents are as low as reasonably practicable. Similarly, the nuclear industry in the UK operates under a tolerability framework where licensees must reduce risks ALARP as part of their nuclear site safety cases. In the offshore oil and gas sector, after the Piper Alpha disaster in 1988, the UK introduced the Offshore Safety Case Regulations (1992) which mandate that operators prepare a Safety Case proving that they have identified major hazards and put in place controls to manage those risks ALARP. In summary, UK regulators (HSE and others) expect companies to provide evidence – through risk assessments, option studies, and sound reasoning – that no further reasonably practicable risk reduction measures remain.
European Union (EU): European high-hazard regulation similarly embodies the ALARP ethos, though sometimes under different terminology. The EU Seveso III Directive (2012/18/EU) – which is implemented in the UK as COMAH and across EU member states – requires operators of major hazard facilities to take “all measures necessary” to prevent major accidents and limit their consequences. This essentially enforces the ALARP principle, as confirmed by the UK’s interpretation of the same phrase in COMAH. EU law tends to emphasize prevention at source and risk reduction to as low as possible, aligning with ALARP even if the exact phrasing can differ. For example, machinery safety directives use terms like “reduce risks as far as possible,” and the nuclear sector uses the ALARA (as low as reasonably achievable) principle for radiological protection, which is conceptually similar to ALARP. EU regulators also set broad expectations for risk tolerability (e.g. requiring risk to public to be negligible where achievable, and otherwise demonstrably controlled). Notably, after major accidents (such as the Seveso (Italy) chemical disaster in 1976 and more recently events like the Toulouse AZF explosion in 2001), EU-wide rules have increasingly pushed industries to demonstrate rigorous risk management. Many EU countries therefore expect ALARP-like demonstrations in safety reports, even if the term “ALARP” itself is of UK origin.
International Context: Outside the UK/EU, the ALARP concept is recognised in various forms. Several countries have adopted ALARP explicitly in their regulations for high-hazard industries – for example, Australia, the Netherlands, and Norway mandate ALARP or equivalent safety management requirements in sectors like offshore petroleum and chemical plants. In these jurisdictions, duty-holders must show that risk-reducing measures have been implemented unless they are not reasonably practicable, mirroring the UK approach (though what counts as “reasonably practicable” can be interpreted within the local legal/cultural context). The United States does not generally use the term ALARP in industrial safety outside of specific areas (the U.S. nuclear industry and radiation protection practices use ALARA, for instance). U.S. process safety regulations (like OSHA’s Process Safety Management rule) are more prescriptive, but even there companies often adopt risk matrices and cost-benefit analyses internally to guide risk reduction, essentially following the ALARP philosophy in practice. International standards (e.g. ISO risk management standards or IChemE guidance) also promote the idea of reducing risk to a “tolerable” or “acceptable” level, which correlates with ALARP. In summary, while the terminology may differ – ALARP (UK), ALARA (US radiation), SFAIRP, “as low as achievable,” etc. – the underlying expectation in high-hazard industries worldwide is that organisations proactively reduce risks and must be able to justify any remaining risk by showing further mitigation would be unreasonable. Legally, failing to do so can mean a breach of duty in ALARP-based regimes or non-compliance with good engineering practice elsewhere.
Risk Tolerability Criteria and ALARP Thresholds
A core part of demonstrating ALARP is understanding what level of risk is considered acceptable, tolerable, or unacceptable. The UK HSE introduced the concept of risk tolerability thresholds in its guidance (notably in documents like “Reducing Risks, Protecting People” and the earlier “Tolerability of Risk (TOR) from Nuclear Power Stations”). This approach divides risk levels into three bands:
-
Unacceptable (Intolerable) Risk: Risks so high that they are unacceptable under any circumstances, and cannot be justified irrespective of benefit. If a risk falls in this region, the activity must be prohibited or substantially improved. For example, HSE has indicated that an individual fatality risk exceeding about 1×10^−4 per year (1 in 10,000 per year) for a member of the public is intolerable, and for a worker, a risk above 1×10^−3 per year (1 in 1,000 per year) is typically intolerable. Such high risks demand immediate reduction. No amount of cost saving or benefit can justify leaving a risk this high.
-
Tolerable if ALARP (ALARP Region): This is the intermediate band of risk where the risk is tolerable only if it is As Low As Reasonably Practicable. In this region, the risk is not so high as to be outright intolerable, but it is not so low as to be negligible. Most industrial risks fall into this zone. Here, the onus is on the operator to keep reducing the risk until it can be demonstrated that further reduction would involve measures that are grossly disproportionate to the benefit gained. In quantitative terms, individual risk to the public between about 1×10^−6 and 1×10^−4 per year (or for a worker between 1×10^−6 and 1×10^−3 per year) would typically lie in the ALARP region. While in this band, all reasonably practicable risk mitigation must be identified and implemented. Regulators expect a detailed ALARP demonstration here – showing what measures have been considered, which have been implemented, and if any possible safety measures were not implemented, providing clear justification (often via risk reduction vs cost arguments) for those decisions. Essentially, risks in this zone can be tolerated only if risk-reducing measures have been taken as far as reasonably practicable.
-
Broadly Acceptable (Negligible) Risk: Risks so low that they are considered broadly acceptable to society and further reduction is not expected as it wouldn’t significantly improve safety. HSE often cites an individual risk on the order of 1×10^−6 per year (one in a million per year risk of death) or lower as “broadly acceptable” for any person. If a risk is in this green zone, it is regarded as trivial – comparable to everyday risks that people accept willingly – and no additional measures are needed unless easily achieved. However, even broadly acceptable risks should be kept under review and reduced if a very easy, cheap improvement is available (since the law still technically requires ALARP everywhere). In practice, though, regulators do not usually require exhaustive ALARP justifications for risks this low.
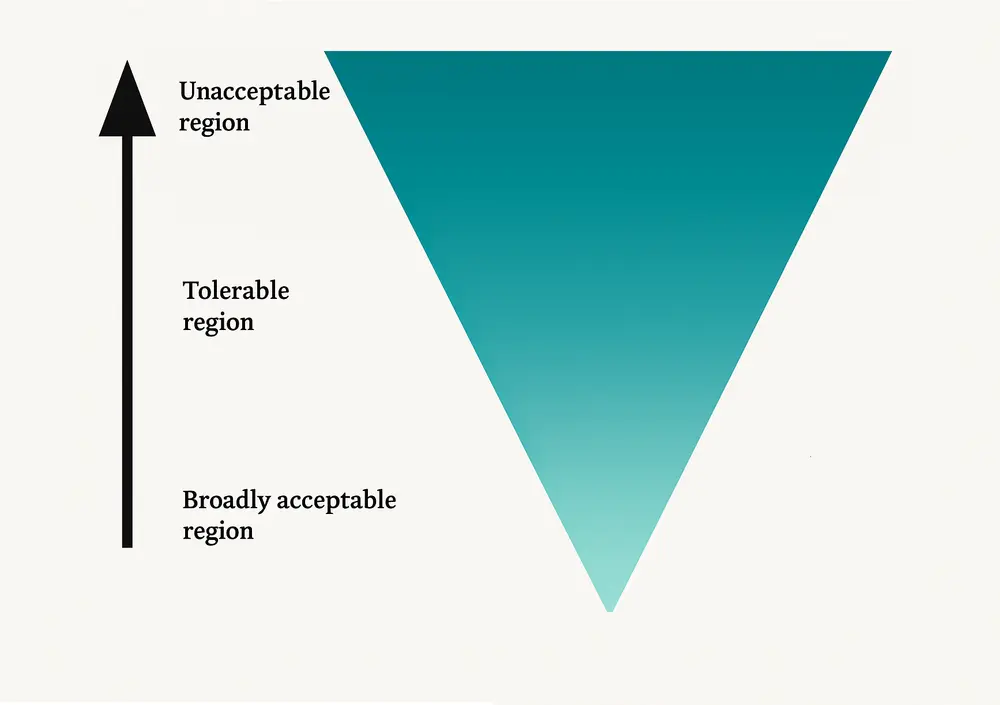
These bands are often illustrated in the classic ALARP triangle (or “carrot” diagram) – with a red zone at the top (unacceptable), a narrowing amber middle, and a broad green base. The diagram visually communicates that as you reduce risk, you move down into the tolerable and then broadly acceptable regions; conversely, higher up the triangle, as risk increases, the scrutiny and requirements become tighter. It is important to note that the ALARP principle itself applies continuously – even in the green region, one should ensure no easy safety improvements are ignored – but the concept of regions helps focus efforts. For instance, if a quantified risk estimate for a scenario lies in the amber ALARP band, one should conduct a thorough options analysis to reduce it further, whereas if it is already well into the green, formal cost-benefit analysis may not be necessary.
Risk Criteria in Practice: Regulators like HSE provide numerical risk criteria as guides (e.g. the fatality risk levels above), and companies often adopt similar or more stringent internal criteria. In addition to individual risk, societal risk (the risk of multiple fatalities in one event) is considered for major installations. Societal risk tolerability is often presented via F-N curves (frequency vs. number of fatalities graphs) with thresholds marking intolerable and ALARP regions (for example, one criterion might be that accidents with 50 fatalities should have a frequency below 1×10^−5 per year). The key point is that ALARP demonstrations usually involve comparing calculated risks against such criteria. If the risk is above the intolerable line, the project or operation must be rethought or the risk reduced drastically. If it is in the tolerable/ALARP region, further mitigations are required until you can show that additional measures would be disproportionate in cost or other negatives. And if it is already below the broadly acceptable line, the risk is essentially already ALARP by virtue of being very low (though good practice measures would still be in place).
It’s worth noting that demonstrating ALARP is not purely a numbers game. Even without precise quantification, the principle requires showing that you’ve applied all relevant good practice (established safety standards, codes and engineering best practices) and then, for any residual risk that’s not obviously negligible, you’ve considered whether more can be done. Often a combination of adhering to standards and doing explicit risk analyses is used. For high-consequence scenarios, formal cost-benefit analysis (CBA) can be part of an ALARP justification – assigning a value to the safety benefit (using metrics like the “Value of Preventing a Fatality”) to weigh against mitigation costs. Regulators like HSE insist that a “gross disproportion” factor is applied, meaning the cost must be grossly in excess of the benefit to justify not implementing a safety measure. This tilts decisions in favour of safety. All these considerations come together in an ALARP demonstration dossier or argument within safety reports.
(Recommended image: an “ALARP triangle” diagram illustrating the three risk regions, with example numerical thresholds for the boundaries, could be used here to visually reinforce the concept of intolerable, ALARP, and broadly acceptable risk zones.)
Tools and Techniques for ALARP Demonstration (QRA, LOPA, FTA, ETA, etc.)
Demonstrating ALARP relies on robust risk assessment techniques to identify hazards, estimate risks, and evaluate the effect of safety measures. Both quantitative and qualitative tools are used to build the case that risks have been reduced to a reasonably practicable minimum. Key tools include:
-
Quantitative Risk Assessment (QRA): QRA is a detailed, numeric approach to risk assessment. It involves modelling the frequencies and consequences of potential accident scenarios to calculate quantitative risk metrics, such as individual risk per year and societal risk (often presented as cumulative frequency vs fatalities). By combining event likelihood (e.g. via fault tree analysis) with consequence analysis (e.g. modelling a fire or toxic release impact), QRA provides a more accurate understanding of the likelihood and impact of major incidents. QRA results are typically compared directly against risk criteria – for example, a QRA for a chemical plant might show that the worst-case explosion scenario has an individual risk to the nearest resident of 2×10^−5 per year, which is within the “tolerable if ALARP” band. The company would then use the QRA to identify dominant risk contributors and add safeguards to lower that risk further if possible. QRAs are especially common in the oil, gas, and chemical industries (and are synonymous with Probabilistic Safety Assessments in the nuclear industry). They are time-consuming and data-intensive, but extremely valuable for ALARP demonstrations because they produce hard evidence that risk is below specified thresholds or show how much risk reduction a proposed measure would achieve. Regulators often expect a QRA for highest-hazard facilities (e.g. LNG terminals, large chemical sites) as part of the safety case. A QRA can also be used to test various “what-if” risk mitigation options. For instance, one might calculate how much the individual risk is reduced if an extra firewater pump is installed or if storage quantities are cut in half, and then decide if the improvement is significant relative to the cost. In summary, QRA quantifies risk and provides supporting evidence to demonstrate that risk is within acceptable/ALARP levels or to identify where further risk reduction is required.
-
Layers of Protection Analysis (LOPA): LOPA is a semi-quantitative tool that sits between a simple qualitative assessment and a full QRA. It is widely used in the process industries (especially chemicals and oil & gas) to evaluate scenario risk by accounting for multiple independent protection layers. In a LOPA, one starts with a hazardous initiating event (e.g. a reactor overpressure) with an estimated frequency, then identifies independent layers of protection (e.g. a pressure alarm with operator action, a relief valve, an independent shutdown system) and assigns each a probability of failure on demand. By multiplying the initiating event frequency by the failure probabilities of all relevant protection layers, you obtain a mitigated scenario frequency. This can be translated into risk (frequency of a bad outcome per year), which is then compared to a target risk criterion to see if the scenario is sufficiently controlled. If not, additional protection layers or safety measures are needed. LOPA often uses order-of-magnitude data (e.g. a generic probability of failure for an operator action or an instrumented system) and typically focuses on one hazardous outcome at a time. It’s particularly powerful for determining the required Safety Integrity Level (SIL) of safety instrumented systems – for example, if a LOPA finds that the frequency of a tank overfill leading to explosion is 1×10^−4/year but the tolerable frequency is 1×10^−5/year, then the final layer (say, an automatic shutdown) must be reliable enough (low enough probability of failure) to reduce the frequency tenfold. LOPA’s strength in ALARP demonstrations lies in its clarity and focus: it shows how each layer contributes to risk reduction and whether all independent layers collectively bring the risk down to the target “ALARP” level. If a gap exists, LOPA results directly point to the need for more layers or more reliable layers. It is a structured way of ensuring no single safeguard is over-relied upon and that the combination of protections meets the ALARP test. Notably, if LOPA analysis shows the risk is still too high even after adding layers, this might trigger a deeper QRA or a re-design of the process. On the other hand, if LOPA shows the risk is comfortably within targets, that scenario’s controls can be considered ALARP. Because it is simpler than a full QRA but more rigorous than a purely qualitative approach, LOPA has become a popular method to document ALARP for many process industry scenarios.
-
Fault Tree Analysis (FTA): FTA is a deductive (top-down) analytical method used to determine the causes and likelihood of a specific undesired event (called the “top event”). It uses a graphical logic tree of faults, where the top event (e.g. “loss of containment of toxic gas”) is linked to intermediate events and basic events through logical gates (AND, OR). By inputting failure probabilities for the basic events (such as “pump fails”, “valve leaks”, “operator fails to respond”), one can calculate the overall probability of the top event. FTA thereby quantifies how different combinations of failures could lead to an accident. In ALARP terms, FTA helps identify the critical failure paths that contribute most to risk. For example, an FTA might reveal that a tank overfill leading to a spill is most likely caused by a level sensor failure combined with a valve failure. Knowing this, the company can focus on improving those particular components or adding redundancy (thus reducing the top event probability). By comparing the new fault tree results with the original, one can show the risk reduction achieved by a measure. FTA is often part of QRA (providing the frequency of the top event which then goes into consequence analysis) and is a very transparent way to demonstrate ALARP for complex systems because it shows all the things that have to go wrong for a major accident to happen, and how the design prevents those. Regulators appreciate fault tree results in safety cases as evidence that the proponent understands the failure logic of their system and has optimized it. For instance, an FTA for an offshore platform’s fire safety system might demonstrate that the probability of a major fire escalating is, say, 1×10^−5 per year with the current safeguards, and that adding one more independent pump would only reduce it to 0.8×10^−5 per year – such information would support an argument that the extra pump, if very costly, may be grossly disproportionate (only a marginal risk improvement) and thus not required by ALARP. In summary, FTA provides both a quantitative lens and a visual map of how risks are being minimized.
-
Event Tree Analysis (ETA): ETA is an inductive (forward-looking) analysis that starts from an initiating event (often an accident or failure) and explores the possible outcomes by considering whether safety functions or mitigation measures succeed or fail in sequence. It is essentially a branching tree of events following an initial event. For example, an ETA for a gas leak might branch into: “gas is detected?” (yes/no), then “ignition occurs?” (yes/no), then “fire suppression works?” etc., leading to outcomes ranging from “incident averted” to “major explosion”. Each branch has an associated probability, so by multiplying along a path you get the probability of each outcome scenario. ETA helps quantify the effectiveness of protective layers and emergency responses in mitigating consequences. For ALARP demonstration, ETA shows how likely a bad outcome is given the layers in place. It often goes hand-in-hand with FTA (ETA on the right side of a bow-tie, FTA on the left side). By doing ETA, an organisation can demonstrate, for example, that even if a loss of coolant occurs in a reactor, the probability of it ending in a core melt is extremely low because multiple systems (emergency cooling, pressure relief, operator actions) are in place and the chance all fail in sequence is minimal. If the outcome probabilities aren’t low enough, the ETA highlights where adding or improving a measure would help (e.g. improving detection to increase the branch where the leak is detected early). In sum, ETA is a tool that can show the event progression is curtailed by the existing safety measures, supporting the argument that risk is under control to a practicable extent. It’s especially useful for emergency response planning (demonstrating that even if an accident starts, the escalation risk is ALARP thanks to mitigation systems).
-
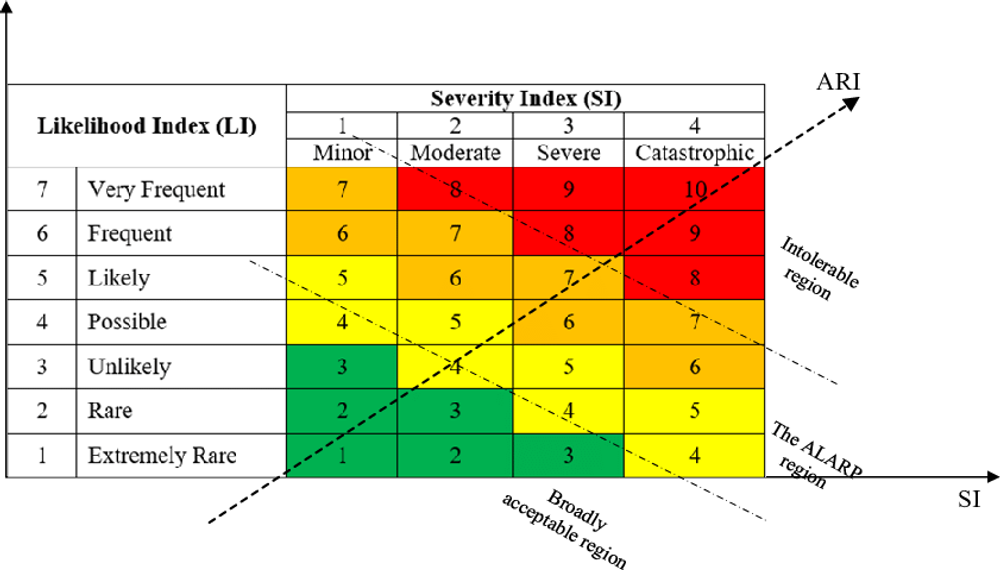
Risk Matrices and Semi-Quantitative Ranking Tools: Not every ALARP decision requires heavy number-crunching. Risk matrices are widely used in industry as a way to qualitatively (or semi-quantitatively) assess and communicate risk levels. A risk matrix typically plots severity (consequence) on one axis and likelihood on the other, with each cell of the grid assigned a risk level (often colour-coded green, yellow, red). Companies often incorporate ALARP concepts into their risk matrix criteria. For example, a “high” risk (red) might correspond to the intolerable region – requiring immediate action or a detailed ALARP justification to even temporarily tolerate. “Medium” (yellow) risks correspond to the ALARP region – acceptable only if risk mitigation is in place and further reduction is not reasonably practicable. “Low” (green) risks correspond to broadly acceptable – no further action needed beyond maintaining good practices. In an ALARP demonstration, a risk matrix can serve as an initial filter: issues that map to red or amber zones will be subjected to more rigorous analysis (like LOPA or QRA) and reduction efforts. While a simple 5×5 matrix lacks the precision of a QRA, it is very useful for prioritising where ALARP efforts should focus (you wouldn’t spend equal effort on a dark green risk as on a red risk). Many organisations maintain ALARP registers or action tracking for any risks that are not green, ensuring that for each such risk, either improvements are being made or a justification is documented if no further improvement is feasible. Other semi-quantitative methods include scoring systems and index-based tools – for instance, Layer of Protection risk graphs, or Hazard Indices – which similarly guide decision makers to where a detailed ALARP analysis is needed. In all cases, the philosophy is that higher risks warrant progressively deeper analysis and more robust justification to prove ALARP, whereas trivial risks can be handled by adherence to standard practice and simple demonstration that they are low.
ALARP in Practice: Cross-Sector Case Studies
To ground these concepts, let’s look at one or two examples of real-world ALARP demonstrations in high-hazard industries. These case studies show how, despite different technical contexts, the same ALARP principles apply.
Case Study 1: Offshore Oil & Gas – Post-Piper Alpha Safety Improvements
Context: The Piper Alpha disaster in 1988 was a turning point for risk management in the offshore oil industry. The explosion and fire on the Piper Alpha platform killed 167 people, revealing major deficiencies in how risks were managed (e.g. inadequate isolation of live systems during maintenance, and failure of emergency systems). The subsequent public inquiry by Lord Cullen made sweeping recommendations, including the adoption of a safety case regime for all UK offshore installations. Under this regime, operators must systematically demonstrate ALARP for major accident risks on their platforms.
ALARP Demonstration: Following these changes, an offshore operator – say in the North Sea – now has to show regulators that for each major hazard (fire, explosion, blowout, etc.), the risk has been reduced to ALARP. In practice, this involves a combination of engineering upgrades and analytical justification. For example, consider the risk of a gas leak leading to an explosion on an offshore production platform. The operator would first ensure all reasonably practicable engineering controls are in place: high-quality gas detection systems, automatic platform shutdown and blowdown sequences, robust firewalls and blast walls to compartmentalize an explosion, deluge (sprinkler) systems to control fires, evacuation lifeboats, etc. Many of these were enhanced industry-wide after Piper Alpha – e.g. installing automatic subsea isolation valves that can shut off oil/gas flow from subsea wells if a riser is damaged, to limit fuel to a fire. Once these measures (largely drawn from industry best practice post-Piper) are implemented, the operator uses risk analysis to demonstrate ALARP. They might perform a QRA showing the individual risk to a worker on the platform from all accident scenarios. If, for instance, the QRA shows a worker risk of 1×10^−4 per year, the company must show this lies in the tolerable range and that further risk reduction would be grossly disproportionate. The analysis would identify the biggest contributors to risk – perhaps a scenario where an emergency shutdown valve fails to close. The ALARP argument might then explain that they considered adding a second independent shutdown valve, which would reduce risk slightly further, but given the existing very low probability of valve failure, the extra reduction in overall risk would be minimal while the cost and complexity are high. This would be backed by numbers (cost-benefit analysis or a “disproportion factor” calculation) and possibly qualitative arguments about increased complexity. Conversely, if the analysis had found any measure with significant risk reduction potential relative to cost – say an extra gas detector in an inadequately covered area – the operator would implement it. Ultimately, the safety case document provides a narrative like: “We have implemented all industry standard measures and several additional safeguards. We examined options A, B, C…; options A and B were adopted, option C was rejected because it would cost £10 million to slightly improve an already very low risk (estimated fatality risk reduction from 1×10^−4 to 0.9×10^−4 per year), which is grossly disproportionate.” The regulator, in reviewing the case, would look for evidence that nothing obvious or cost-effective has been left out. In effect, the post-Piper safety regime forces operators to think through every major hazard scenario and defend their decisions. The North Sea industry saw many tangible safety improvements due to this ALARP process – for example, better temporary refuges (blast-proof living quarters where crew can shelter), more reliable communication systems and permit-to-work systems, etc., all justified as reasonably practicable after the disaster. The result has been a significant reduction in major accident risk offshore, showing how ALARP demonstration is not just a paper exercise but drives real safety enhancements. The Piper Alpha case underscores a cross-sector principle: catastrophic events often lead to stricter ALARP expectations, compelling industries to adopt state-of-the-art safety measures and demonstrate their necessity.
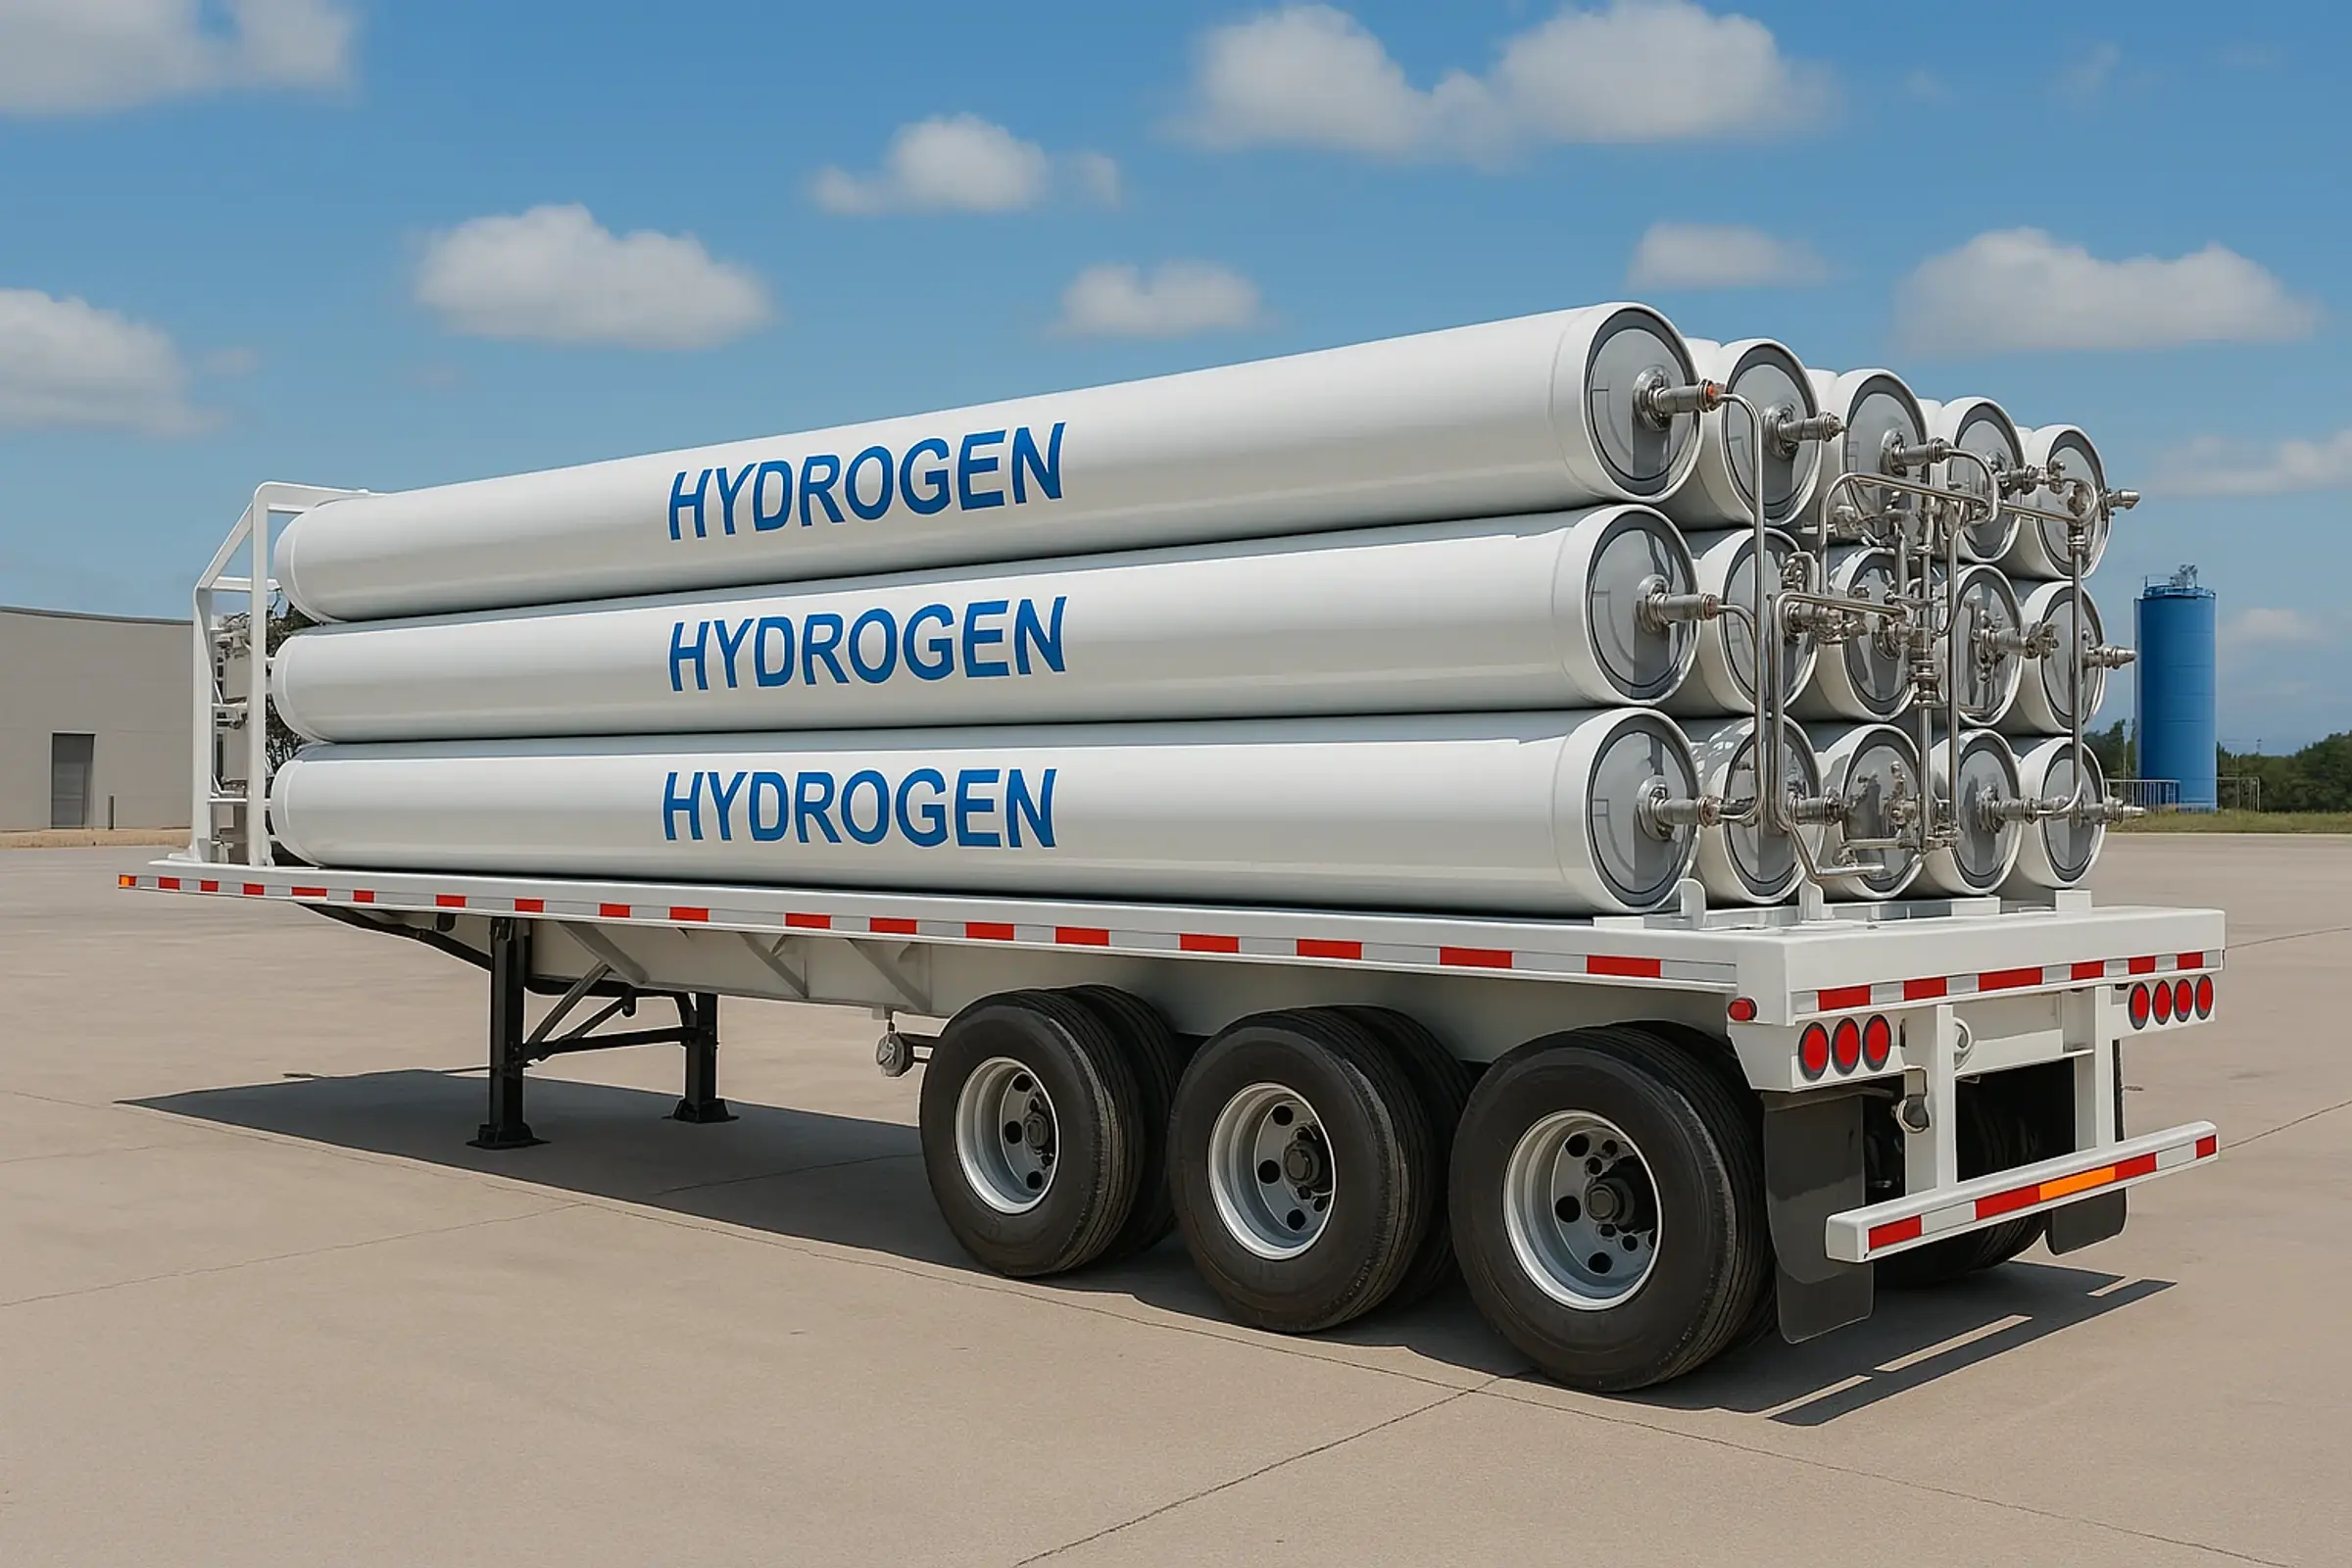
Case Study 2: Hydrogen Fuelling Station – Using QRA for New Technology Risks
Context: With the rise of hydrogen as an energy carrier, new types of high-hazard installations are appearing, such as hydrogen refuelling stations for fuel cell vehicles. These stations store hydrogen at high pressure and dispense it into vehicles – a process that, if something goes wrong, carries risk of fire or explosion (hydrogen is very flammable and has a wide ignitable range). While hydrogen technology is new, the ALARP principle still applies to ensure these facilities are as safe as practicable. Regulators and developers have been keen to show that hydrogen fuelling can be done without introducing unacceptable risks to the public.
ALARP Demonstration: Consider an urban hydrogen refuelling station. A Quantitative Risk Assessment might be performed to evaluate the risks to nearby members of the public and station staff from potential accidents (e.g. a catastrophic storage tank rupture, a leak from a dispenser hose leading to a jet fire, etc.). One real-world study in South Korea examined a hydrogen station in Seoul and calculated the individual risk to the public both with and without certain safety improvements. Initially, the risk might have been above the broadly acceptable region, given the station’s proximity to the public. Engineers identified that by installing a dual shut-off valve system on the hydrogen lines (essentially two automatic isolation valves in series that can cut off flow if a leak is detected), they could significantly reduce the chance and size of an accidental hydrogen release. The QRA results showed that with this mitigation, the station’s individual risk was reduced to about 7.5 × 10^−5 per year, which brought it below the HSE’s ALARP threshold for the public (around 1×10^−4 per year) and into the broadly acceptable region. In other words, adding the extra shut-off valves made the risk “as low as reasonably practicable” – further major risk reduction would require drastic changes such as eliminating hydrogen storage entirely or relocating the station, which would be impractical in an urban setting. The study also looked at societal risk (the risk of an event causing multiple casualties) and found that the measure kept societal risk within Dutch ALARP criteria as well. This kind of analysis allows the operator to demonstrate with hard data that a specific design improvement achieved ALARP.
In practice, when seeking approval for the station, the operators would present this analysis to authorities, showing: “We identified credible worst-case scenarios. We implemented a suite of safety measures: high-quality pressure relief devices, hydrogen detectors that trigger automatic isolation, safety distances per standards, and a dual shut-off valve on the storage. With these in place, the worst-case risk to any individual is on the order of 1 in 100,000 per year or lower, which is in the broadly acceptable zone and comparable to a petrol station.” They would also note that they considered other measures – for example, a blast wall around the storage or limiting the on-site inventory – and explain why those gave negligible additional risk reduction or conflicted with operational requirements, and thus were not reasonably practicable. This mirrors ALARP demonstrations in more established industries: identify the major hazards, put layers of protection, quantify the risk, and then justify that all significant risk reducers are in place. The hydrogen station case also illustrates how ALARP is a moving target with technology: as hydrogen fuelling is new, there is careful scrutiny to ensure new facilities meet at least the same safety level as conventional fuels. Cross-sector, the principle is that new technologies should not introduce higher risk if there are known measures to control it. Lessons from industrial gases and chemical plants (like automated emergency isolation) are applied to hydrogen.
Overall, the hydrogen station example shows ALARP in action in a modern context: using QRA and engineered safeguards to achieve risk levels on par with what society expects (similar to a CNG or petrol station) and demonstrating that any further risk reduction would be unreasonable (for instance, one could always say “if we halved the storage pressure the risk would drop further,” but that might defeat the purpose of the station – at some point you hit diminishing returns and impracticability). It underscores that ALARP is a universal approach: whether it’s a 40-year-old oil platform or a cutting-edge hydrogen facility, the operators must identify hazards, put in layers of protection, and then convincingly argue that any remaining risk is as low as it can be without disproportionate effort.

In conclusion, demonstrating ALARP in the process industries is about combining sound engineering, rigorous analysis, and informed judgement to ensure that no significant safety improvement has been overlooked or refused without good reason. Regulatory frameworks in the UK, EU, and elsewhere provide the impetus and criteria, but it’s the detailed risk assessments (from qualitative reviews to full QRAs) that build the case. By setting clear risk tolerability thresholds, industries know the targets they must meet – reducing risks to the “broadly acceptable” wherever possible, and meticulously justifying any decision to accept risks in the “tolerable if ALARP” range. The case studies illustrate that while technologies differ, the ALARP process – hazard identification, layers of protection, cost-benefit reasoning, and documentation – is fundamentally the same across an oil platform, a chemical plant, a nuclear facility, or a hydrogen station. Adhering to ALARP not only is a legal duty in many jurisdictions, but it also drives a culture of continuous risk reduction. It ensures that safety is not a one-time checkbox but an ongoing commitment: as new techniques or safer designs become available, what is “reasonably practicable” can evolve, and so the journey toward lower risk continues. For professionals in the process industry, mastering ALARP demonstrations means being able to convincingly answer: “Why is this risk as low as we can reasonably make it?” – using evidence and reason that will stand up to scrutiny. When done properly, ALARP demonstrations provide confidence to regulators, the workforce, and the public that even in high-hazard activities, risks are under robust control.
Recommended Images
-
ALARP Risk Tolerability Diagram: An illustrative chart (often triangular or “carrot”-shaped) showing the three regions of risk: a red zone at the top labelled “Unacceptable Risk,” an amber middle zone labelled “Tolerable if ALARP,” and a green wide base labelled “Broadly Acceptable Risk.” Example individual risk criteria (such as 1×10^−3 per year for workers or 1×10^−4 per year for public as the boundary of intolerable, and ~1×10^−6 per year as the boundary of broadly acceptable) can be marked on the diagram. This image reinforces the concept of ALARP thresholds and is commonly used in HSE guidance.
-
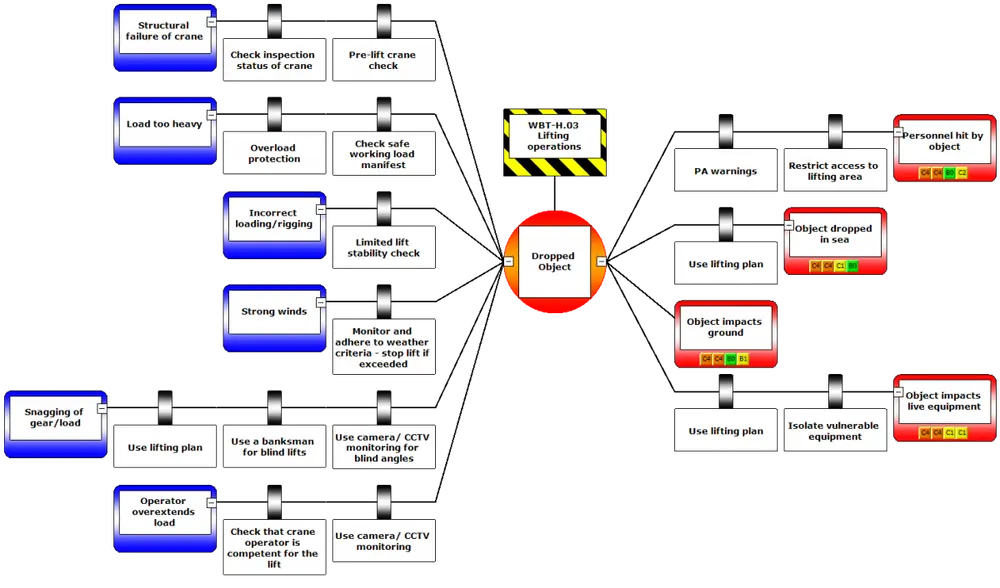
Bowtie or Barrier Diagram: A diagram showing a bowtie model for a major hazard scenario, which is a visual representation of fault and event tree analyses. In the center is a hazard event (e.g. gas release leads to explosion). On the left side, various causes or threats are depicted, each with preventive barriers (like maintenance, alarms, automatic shut-off valves) shown as vertical bars. On the right side, the consequences of the central event are depicted (fire, fatalities, environmental damage), each with mitigation barriers (firewalls, sprinklers, evacuation plans). Such an image would help readers visualise how multiple independent layers of protection are arranged to reduce the risk – embodying ALARP by preventing an initiating event and mitigating consequences if it occurs. This is a cross-industry tool (used in oil and gas, chemical, aviation, etc.) to communicate that all practicable barriers are in place.
-
Risk Matrix with ALARP Zones: A 5×5 risk matrix diagram (or similar) where likelihood is on one axis and severity on the other. The cells of the matrix are coloured green, yellow, red corresponding to low, medium, high risk. Overlaid on the matrix, annotations can indicate that green corresponds to broadly acceptable risk, yellow corresponds to the ALARP region (tolerable only if further reduction is impracticable), and red is intolerable risk requiring urgent action. This image would illustrate how organisations integrate the ALARP concept into day-to-day risk assessment—by classifying and treating risks according to these categories. It makes the abstract ALARP categories more concrete in terms of an operational risk register.