Understanding Demand Modes for Safety Instrumented Functions
This examination of low, high and continuous demand modes for Safety Instrumented Functions under IEC 61511 addresses the critical differences and the implications for SIL determination and SIL verification, and practical implementation challenges. The article explores the fundamental distinction between PFDavg and PFH metrics, provides sector-specific case studies, and offers advanced guidance for avoiding common pitfalls in process safety applications.
Introduction: The Critical Importance of Demand Mode Classification
The accurate classification of Safety Instrumented Functions (SIFs) into low, high, or continuous demand modes stands as a fundamental determinant in achieving functional safety compliance under IEC 61511. Misclassification remains disturbingly prevalent across the process industries, leading to either over-engineered safety solutions or, more dangerously, under-protected processes. The boundary between these operational modes—defined by the demand frequency threshold of once per year—carries profound implications for Safety Integrity Level (SIL) determination, verification methodologies, and ultimately, the reliability of safety instrumented systems when called upon to mitigate hazardous events.
1. Fundamental Principles: Defining Demand Modes
1.1 Operational Definitions and Boundaries
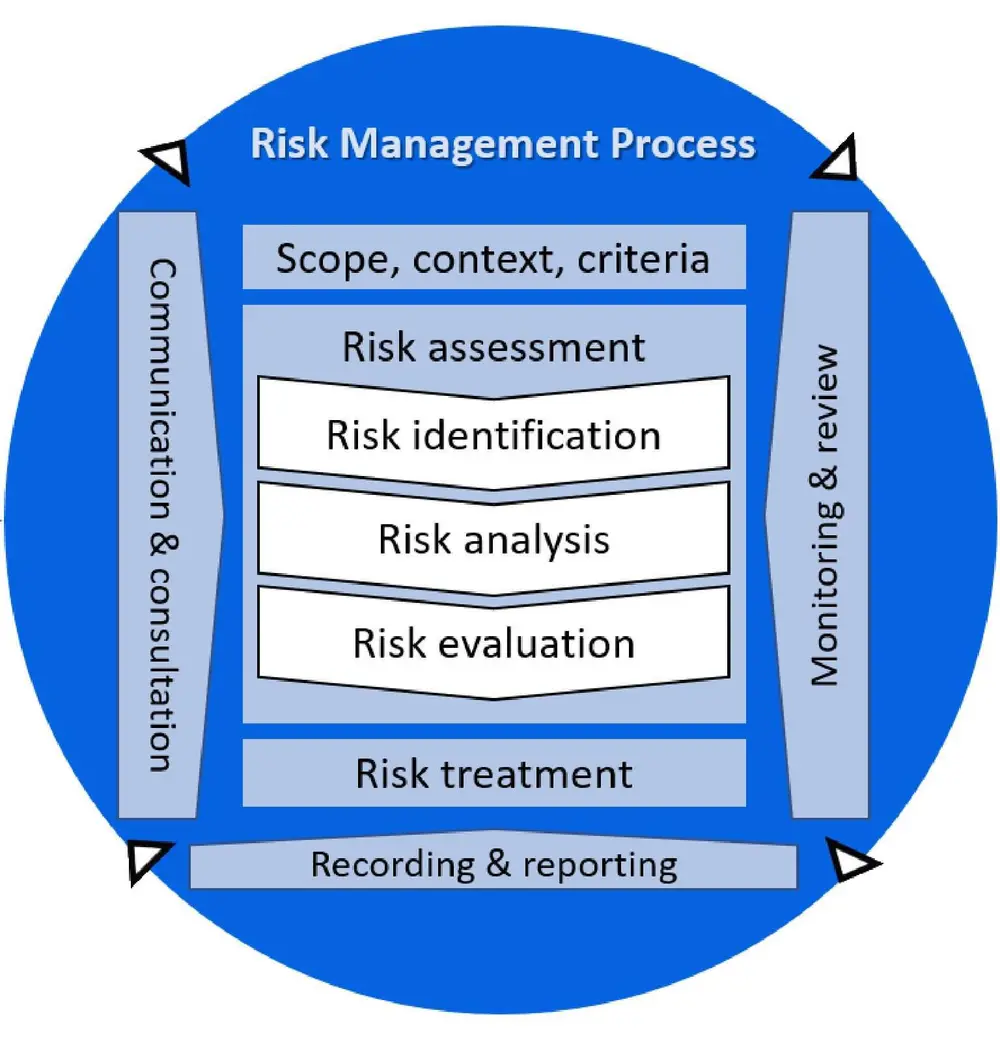
IEC 61511 distinguishes three operational modes for Safety Instrumented Functions based on demand frequency:
- Low demand mode: Where the safety function is required to respond to a hazardous event no more than once per year. Example: A high-level trip on a storage tank that only activates during rare control system failures.
- High demand mode: Where demands occur more frequently than once per year but not continuously. Example: A compressor surge protection system that activates several times monthly during process upsets.
- Continuous mode: Where the safety function is essentially in constant operation to maintain the safe state. Example: A burner management system maintaining safe combustion ratios.
1.2 Characterising Safety Function Types
Table 1: Comparison of Safety Instrumented Function Demand Modes
| Characteristic | Low Demand Mode | High Demand Mode | Continuous Mode |
|---|---|---|---|
| Demand Frequency | ≤1/year | >1/year | Constant operation |
| Primary Safety Role | Reactive barrier | Proactive barrier | Continuous risk control |
| Key Metric | PFDavg | PFH | PFH |
| IEC 61511 Focus | Primary coverage | Limited guidance | Limited guidance |
| Typical SIL Target Range | SIL 1-3 | SIL 1-3 | SIL 1-3 |
| Common Examples | Emergency shutdown systems, pressure relief | Machinery protection, compressor surge control | Burner management, dynamic positioning |
2. SIL Determination Methodologies Across Modes
2.1 Low Demand SIL Determination Process
For low demand SIFs, the risk reduction requirement derives from the equation:
Hazard Rate (h) = Demand Rate (d) × PFDavg
Therefore, the required PFDavg = h / d, which directly corresponds to the Risk Reduction Factor (RRF) of 1/PFDavg.
2.2 High/Continuous Mode Determination Challenges
High and continuous modes require fundamentally different approaches because the SIF failure itself becomes the initiating event for the hazardous scenario. The hazard rate (h) equals the SIF's dangerous failure frequency (PFH), making the calculation:
h = PFH

3. Verification Metrics: PFDavg vs PFH Demystified
3.1 Theoretical Foundations
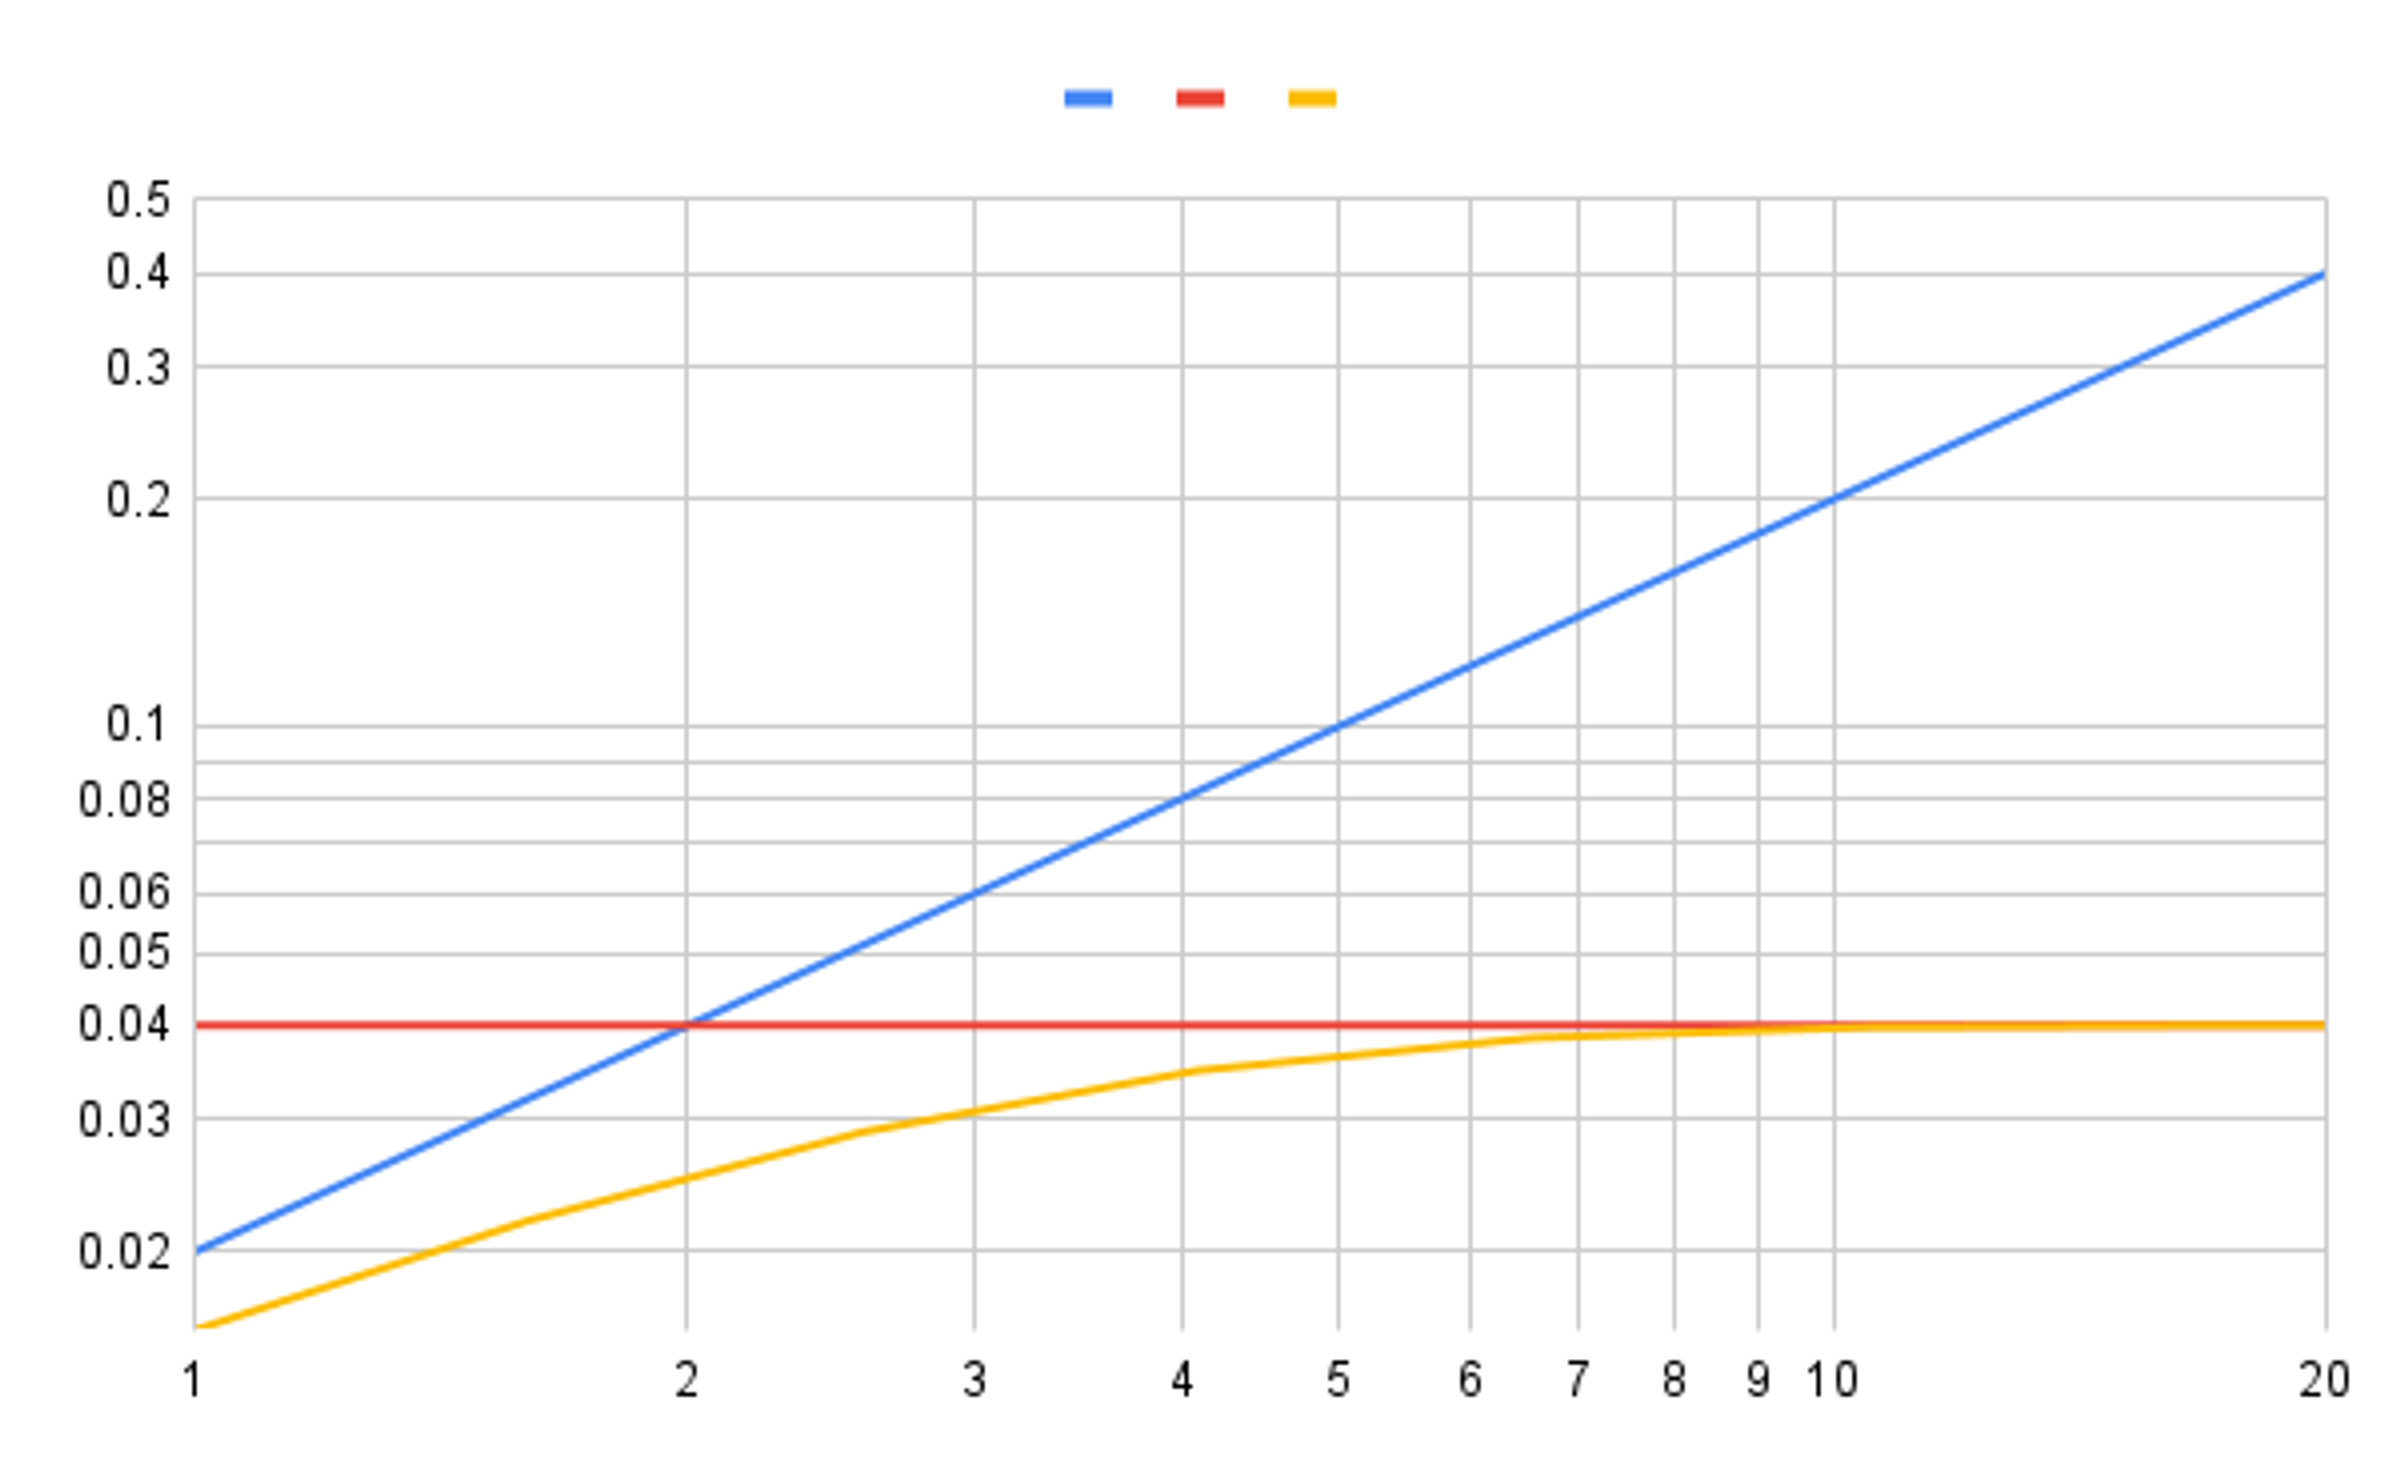
The distinction between PFDavg and PFH represents more than different calculation methods—it reflects fundamentally different failure modelling paradigms:
- PFDavg: Defined as the average probability that a SIF fails to respond when demanded.
- PFH: Represents the frequency of dangerous failures per hour, equivalent to the hazard rate when the SIF operates in continuous mode.
4. Design Implications and Verification Challenges
4.1 Architectural Requirements
High and continuous demand modes impose more stringent design requirements:
- Diagnostic Coverage: Typically >90% for SIL 2 and above
- Hardware Fault Tolerance: More redundant architectures often required
- Cyber-Security: Enhanced measures against malicious access

5. Common Pitfalls and Practitioner Solutions
5.1 Frequent Errors in Application
Analysis of functional safety audits reveals recurring mistakes:
- Demand Rate Miscalculation: Overlooking all demand scenarios
- Metric Misapplication: Using PFDavg for high demand systems
- IPL Misclassification: Counting ineffective post-SIF protections
- Testing Neglect: Assuming diagnostics eliminate proof testing needs
6. Advanced Implementation Recommendations
6.1 Specification Best Practices
- SRS Clarity: Explicitly state demand mode classification rationale
- LOPA Specialisation: Develop high demand-specific worksheets
- Lifecycle Integration: Address mode-specific requirements throughout
Conclusion: Integrating Demand Mode Thinking into Safety Culture
Accurate demand mode classification transcends technical calculation—it represents a fundamental understanding of a SIF's operational role within the process safety framework. The 5-10% of high/continuous demand SIFs typically present disproportionate risk significance due to their frequent activation and immediate failure consequences.
References
- Basics 17: PFH (Probability of dangerous Failure per Hour)
- Reliability analysis of safety-instrumented systems operated in high-demand mode
- SIL - Low Demand Mode v/s Continuous Mode
- Using field feedback to estimate failure rates of safety-related systems
- Performing A Lopa For A High Demand Mode Case